
Excerpts from The Internet Peering Playbook: Connecting to the Core of the Internet
This chapter is written primarily for a Chief Financial Officer at an ISP who asks the question:
“Tell me why we should burn a port that might otherwise be generating revenue from customers.”
I will present a systematic analysis for determining if and when peering makes financial sense. This topic is one of the most popular, and the analysis I present is done by just about every entity looking to attach at the core of the Internet. This chapter is an essential one for all interested in Internet Peering.

William B. NortonAugust 2011 in Accra, Ghana.
To illustrate the Peering vs. Transit decision, let’s enhance our previous peering model with some specific market price points collected at the DE-CIX Customer Meeting in Frankfurt, Germany, in late 2010.
Transport Cost Data Points. At the DE-CIX 2010 meeting, Edward Punt (KPN) and Sven Engelhardt (TiNet) shared pricing estimates for three categories of 10G transport circuit into the European IXP. They said that pricing tends to vary based on how close one is to the IXP:
Local: $2,000 per month for a local 10G connection into an IXP
Nearby: $4,000 per month for a 10G originating in a nearby country
Far: $6,000 per month for a Pan-European 10G circuit
At the meeting, a Slovenian ISP validated these price points. He shared with the group that the 10G circuit from Slovenia into the DE-CIX in Frankfurt was quoted as high as $7000 per month, and that from Budapest to the DE-CIX was about $6000 per month. So these numbers appear to be in the right ballpark for our analysis.
We will first determine the unit cost of peering at 10G.
Let’s start with the assumption that the ISP is coming from far away and will purchase a 10G transport circuit into an IXP for $6,000/month.
At the IXP, let’s assume the 10G peering port costs $2,000 per month, and a powered half rack costs $1000/month, as shown in Figure 5-1.
We will add some equipment costs into the mix as well. A Cisco 6509 might amortize to about $2,000 per month.
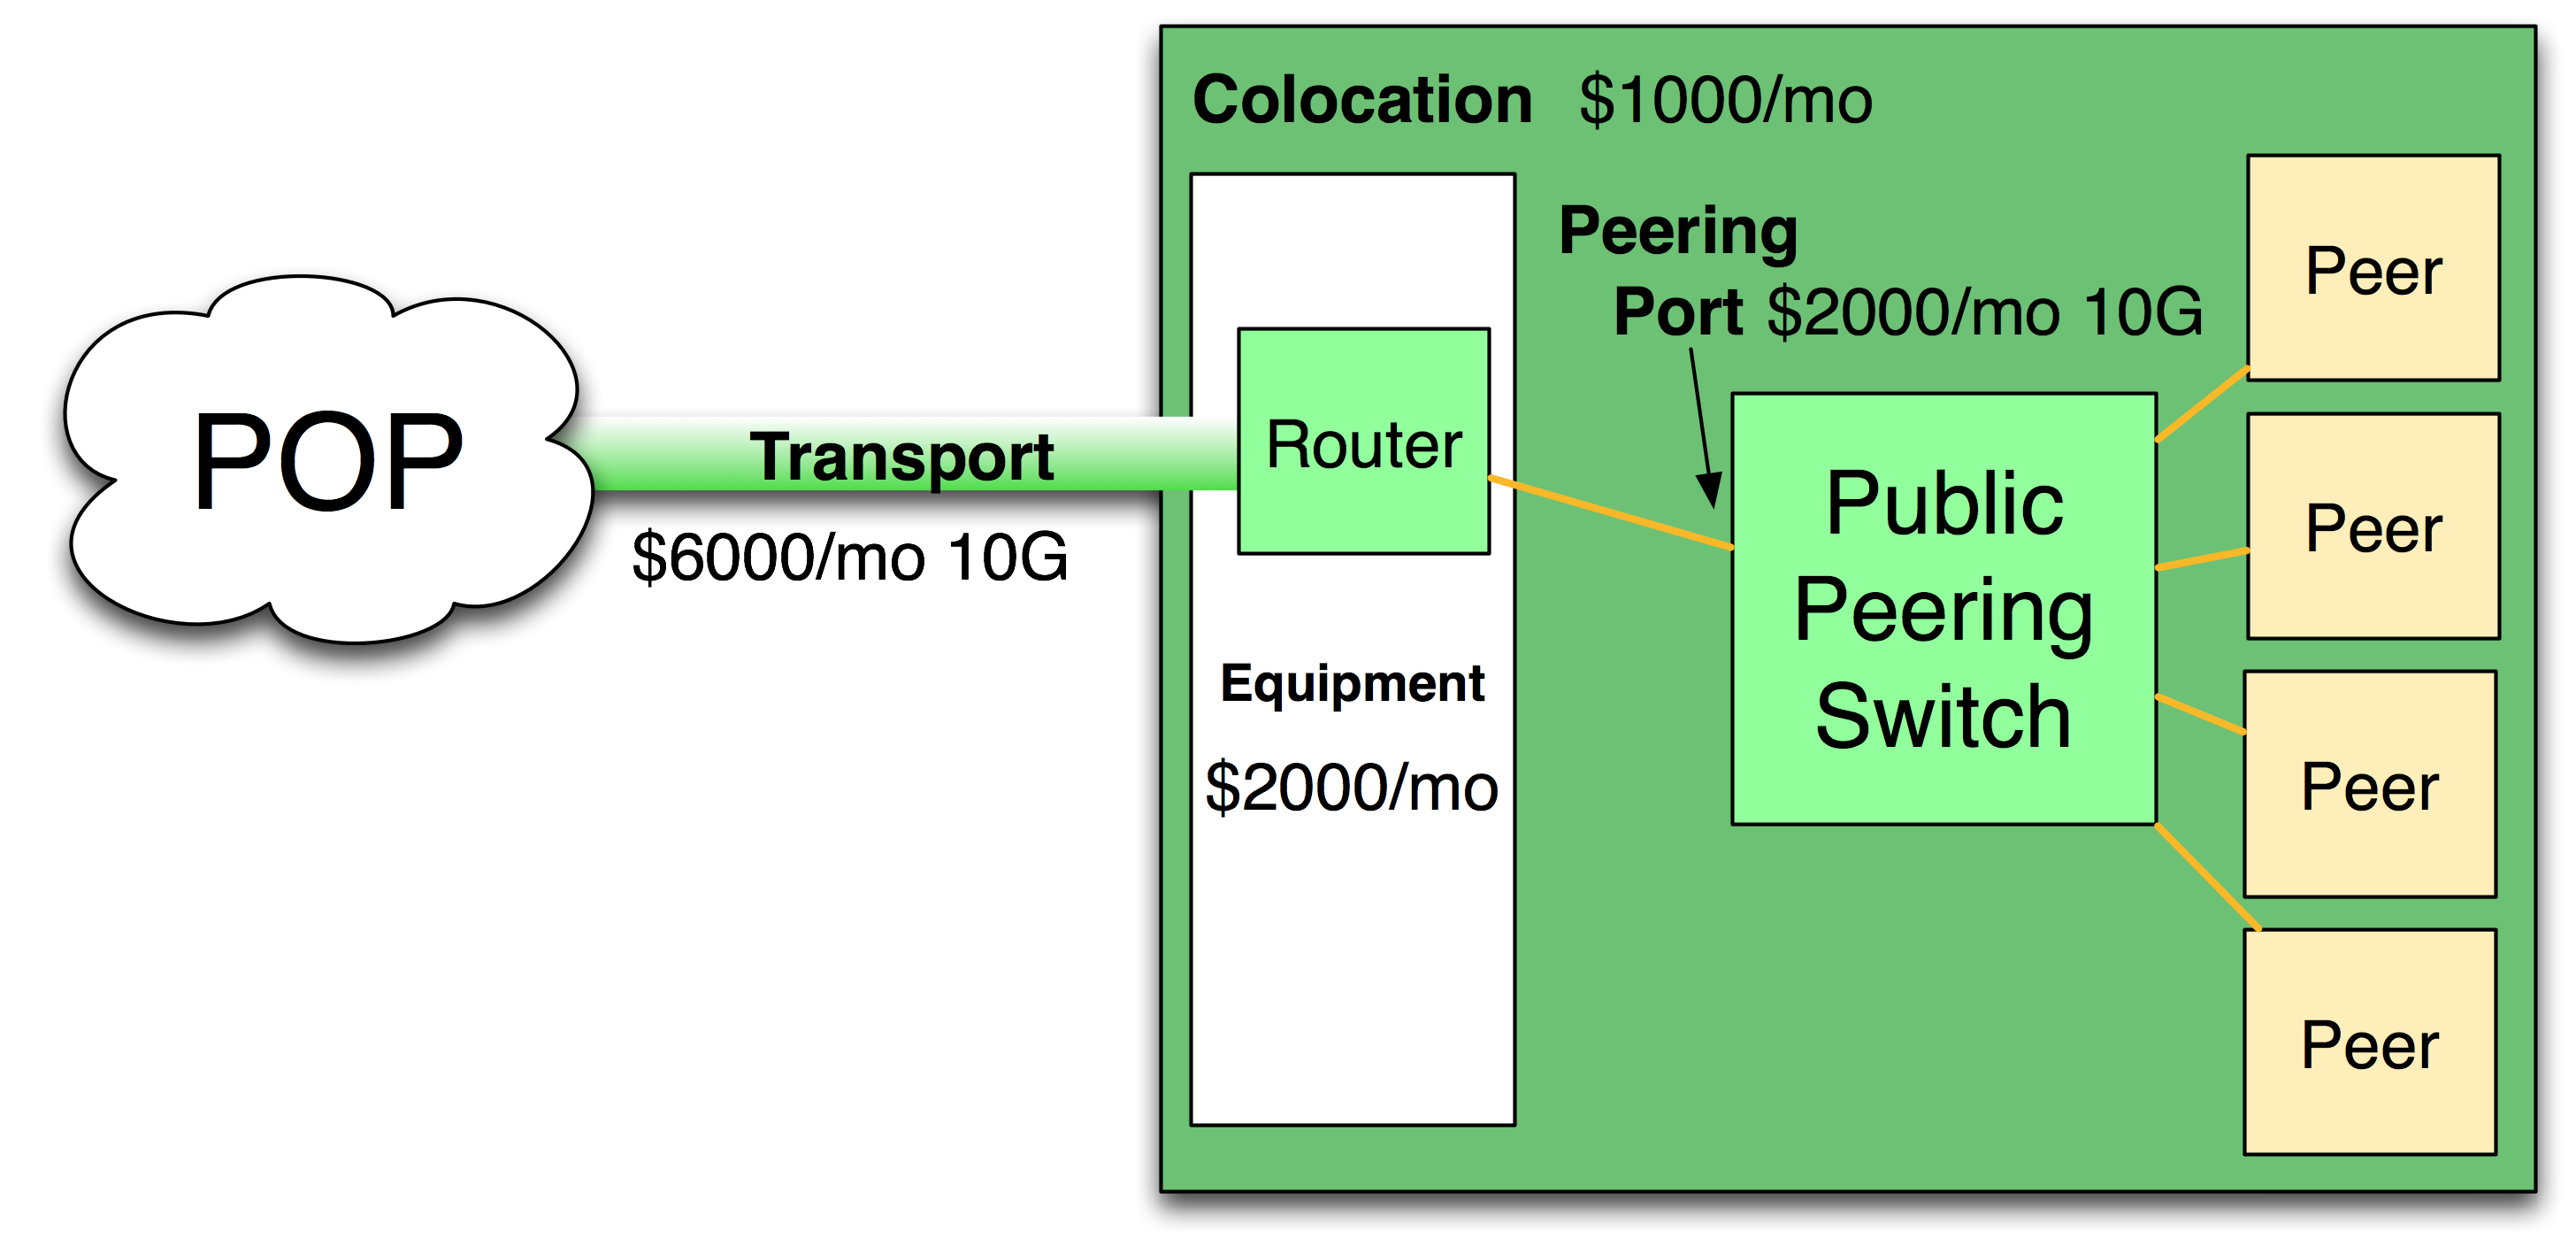
Figure 5-1. Sample cost of peering at an IXP.
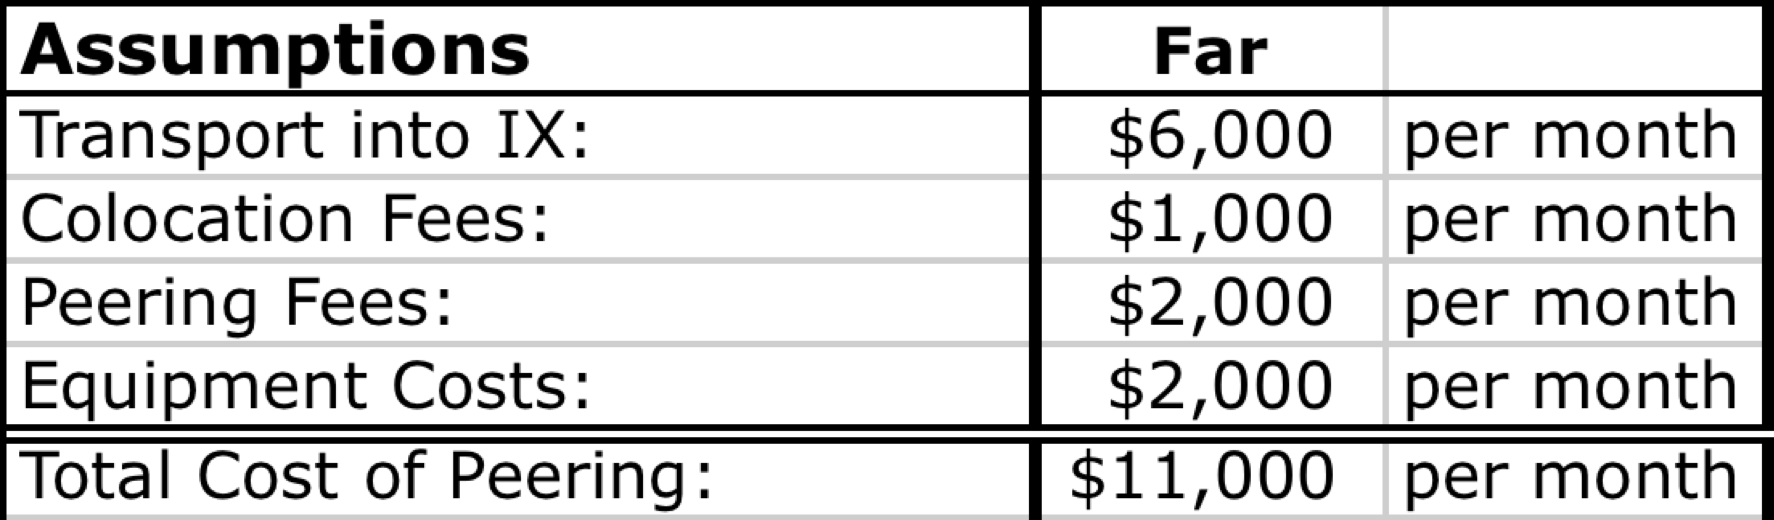
With all of these costs accounted for, we see a monthly cost of peering of $11,000 per month, as shown in Table 5-1.
Table 5-1. The cost of peering using cross-continent transport.
Question: Given these figures, how much does it cost to peer 1Gbps over this 10Gbps infrastructure?
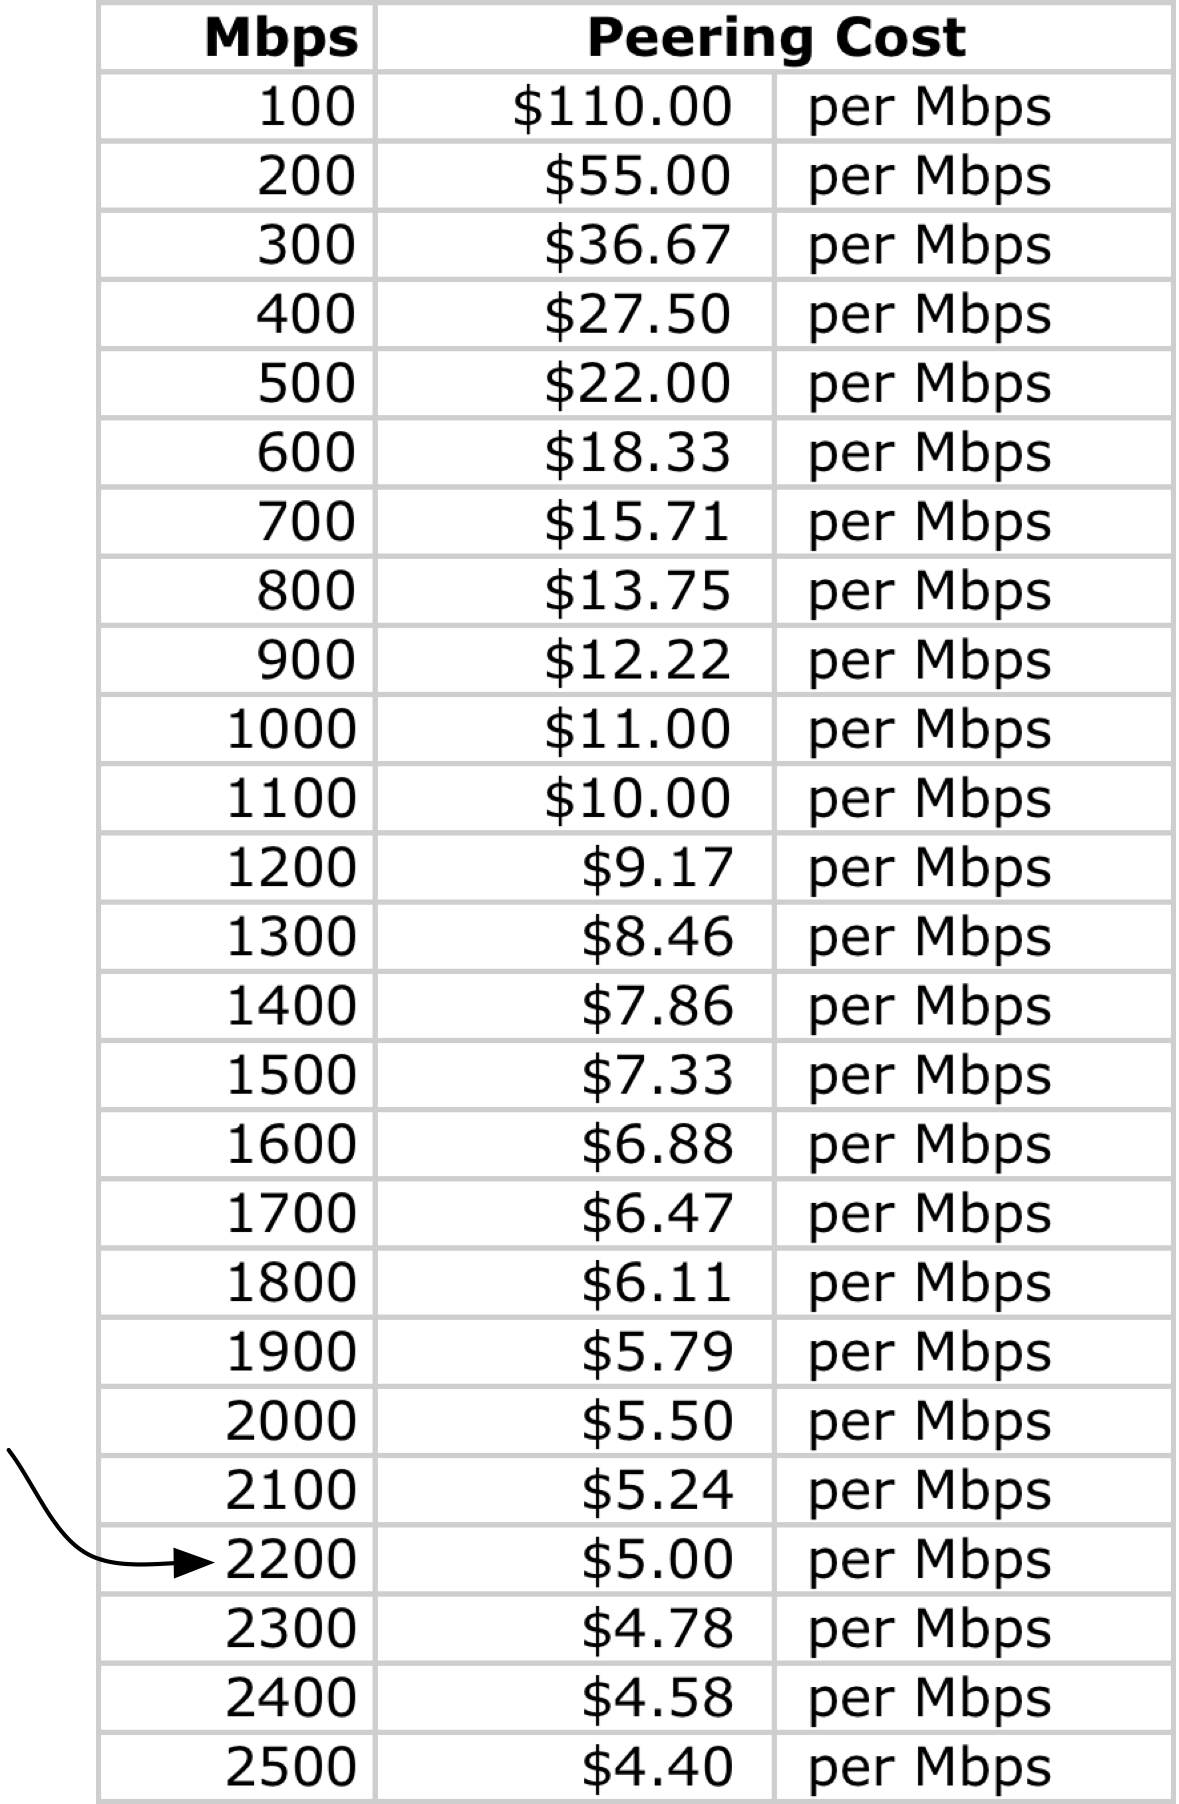
To answer this question, we need to normalize peering costs into the same terms as transit costs. We need to compare both peering and transit on a Megabit-per-second basis. To do this we divide the fixed monthly cost of peering by the amount of traffic we will peer across the infrastructure.
For example, since peering costs $11,000 per month, and we will peer 1Gbps (1000Mbps) over that infrastructure, we will realize a cost of $11,000/1000Mbps= $11.00 per Mbps when that 1Gbps of traffic is peered.
As shown in Table 5-2, when we peer away 2.2Gbps of our traffic, the unit cost for traffic exchange is $5/Mbps.
Table 5-2. Allocating the costs of peering across the amount of traffic peered.
Now let’s generalize the analysis.
Four key peering metrics describe the effectiveness of peering:
I will walk through each of these peering vs. transit calculations in turn.
To determine if peering makes sense, we need to identify the point at which the cost of peering equals the cost of transit. At this point, an ISP is indifferent between peering and simply sending that traffic through a transit provider. To calculate this metric, we first add the costs of peering and allocate those costs across the capacity of the peering infrastructure. The result is the curve in the Peering Break-Even graph shown in Figure 5-2.
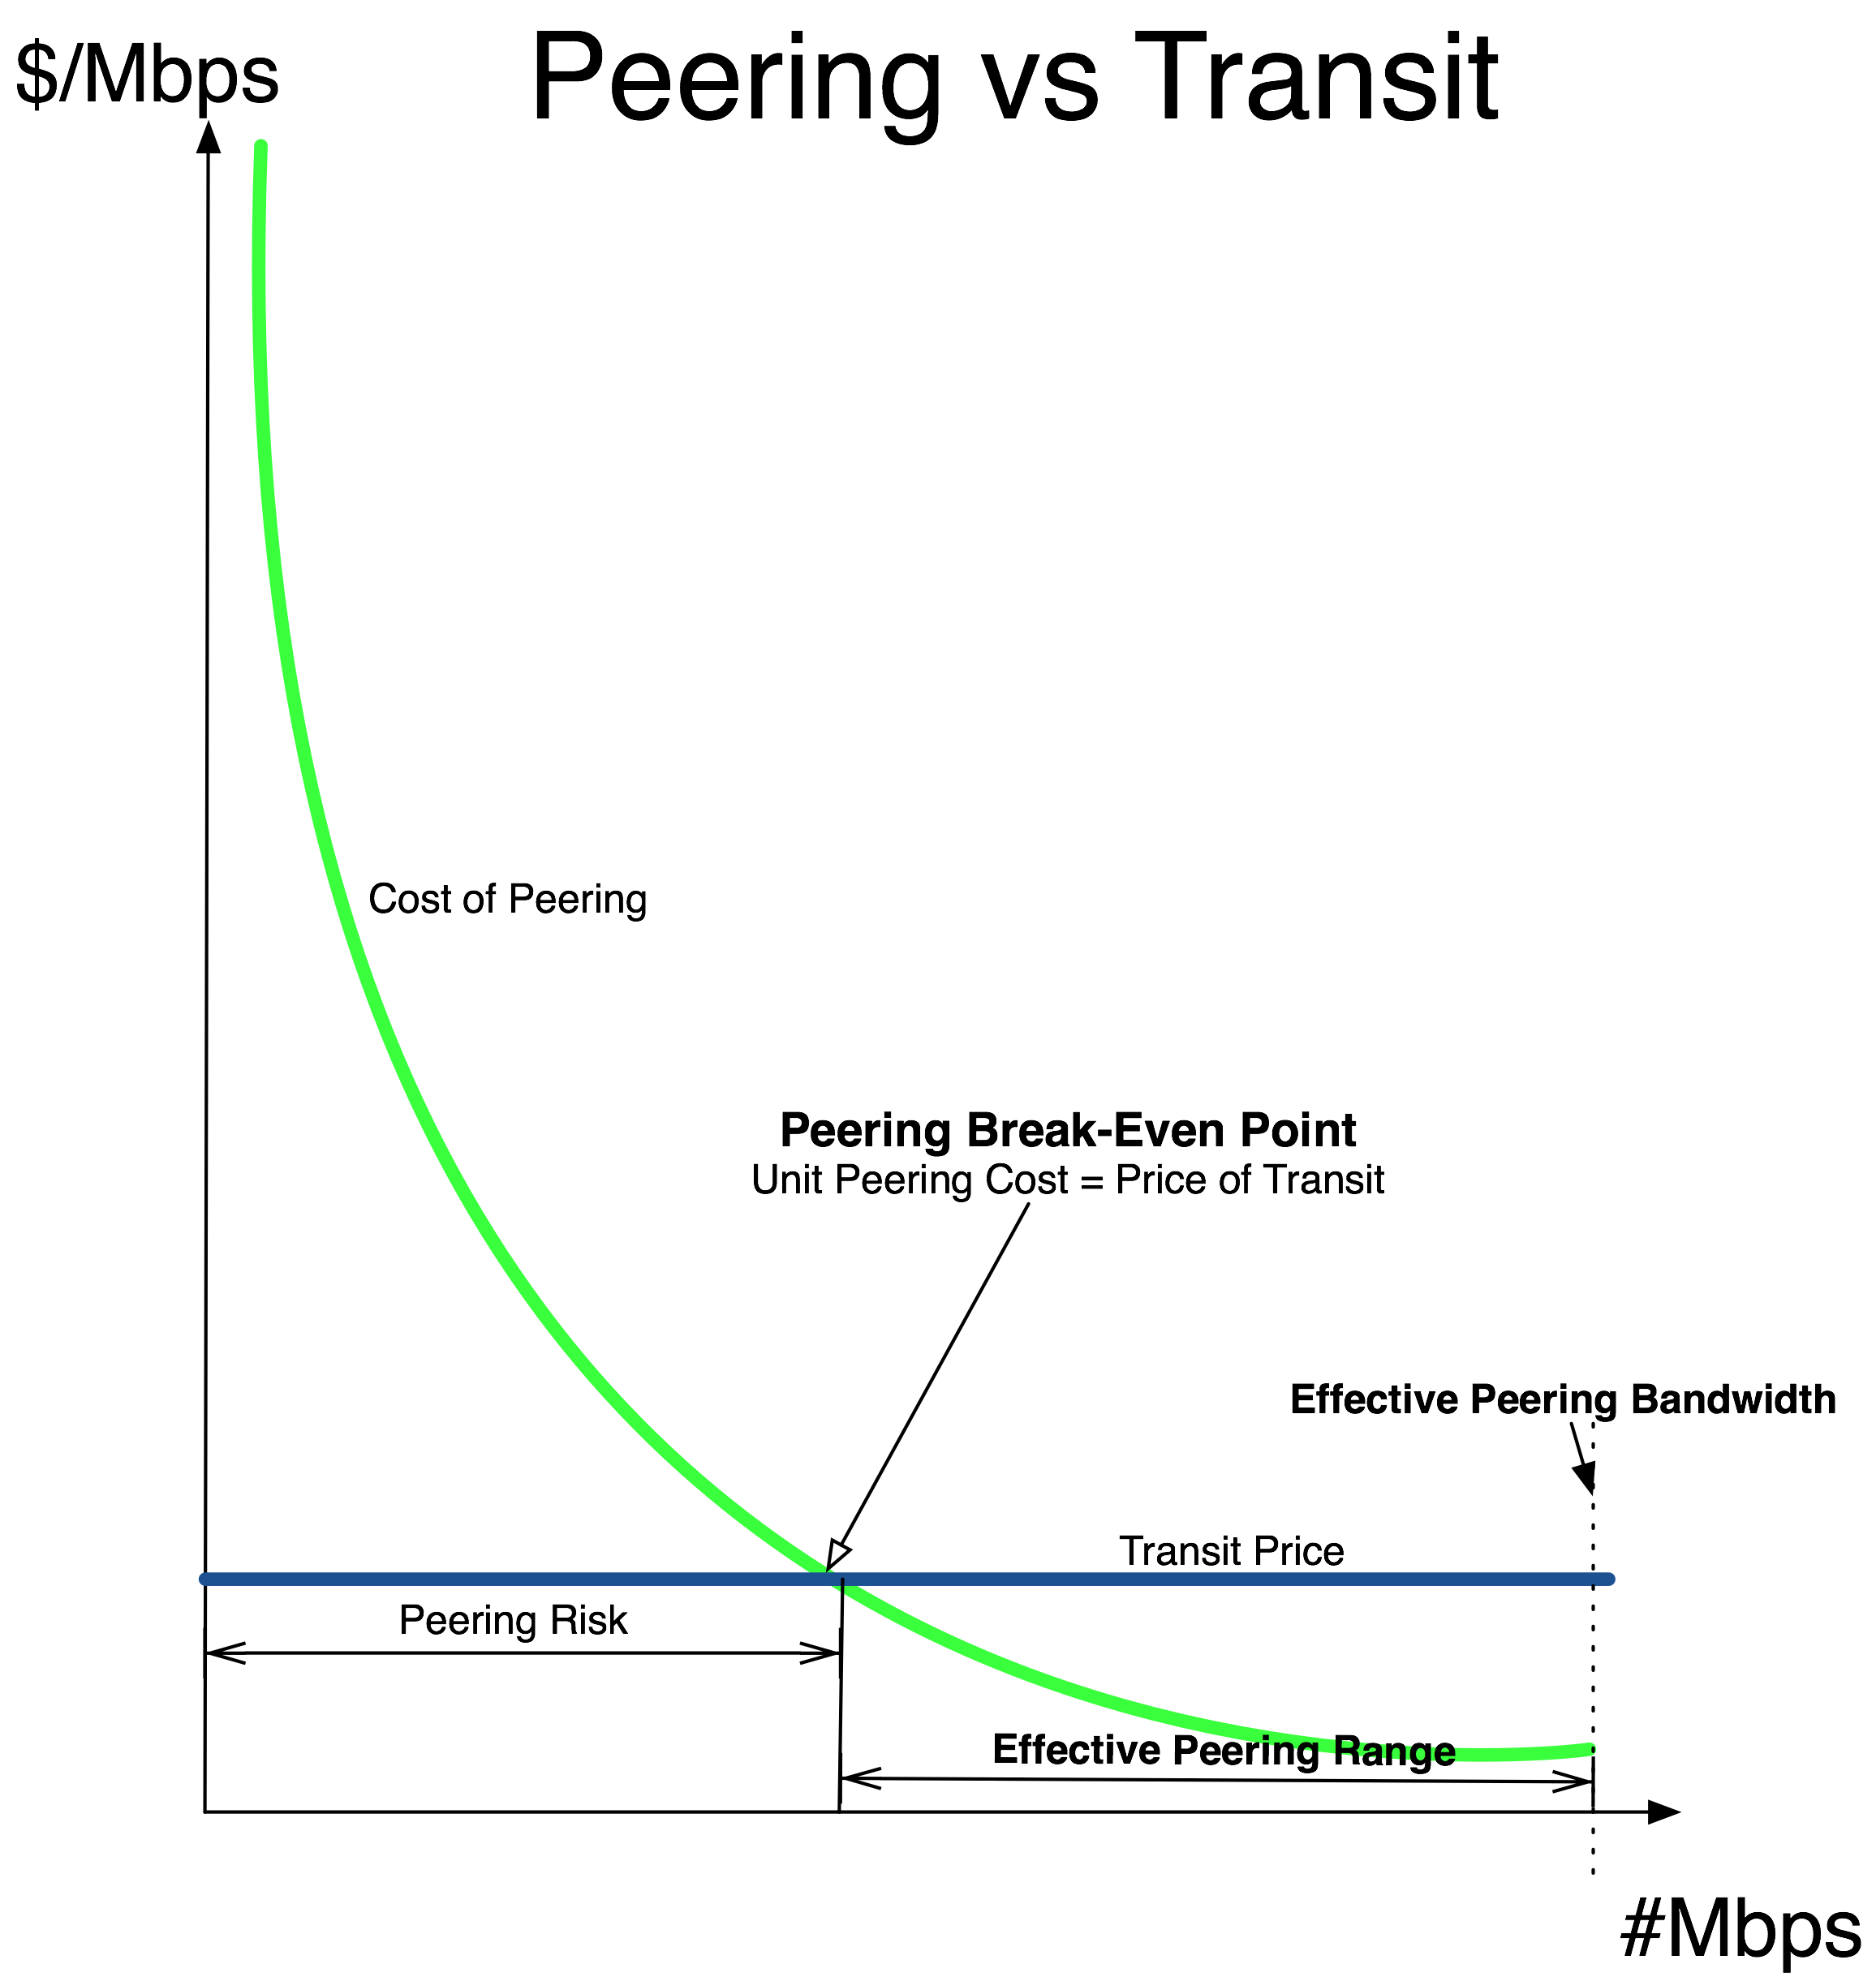
Figure 5-2 The Peering Breakeven Point
In this graph we also plotted the cost of the next-best alternative for offloading that same traffic, the market price of Internet Transit. (We assume for simplicity that the price of transit is fixed, not tiered.)
The point at which these two lines intersect is called the Peering Break-Even Point.
Definition: The Peering Break-Even Point is the point at which the unit cost of peering exactly equals the unit price for Internet Transit.
To calculate the Peering Break-Even Point, we allocate the monthly costs of peering across the market price for transit.
PeeringBreakEvenPoint = MonthlyCostofPeering/UnitPriceofTransit
Beyond the Peering Break-Even Point (see Figure 5-2), the ISP peers more than enough traffic to completely cover the cost of peering. The monthly transit bill is lowered more than the total cost of peering.
Savings = (MbpsPeered-PeeringBreakEvenPoint)*MarketTransitPrice
To the left of the Peering Break-Even Point is an area I call “Peering Risk”. The risk here is of not peering enough traffic for free to offset the monthly cost of peering. When the unit price of transit is less than the unit cost of peering, peering does not provably make financial sense. This situation is where many of the smaller ISPs find themselves today.
The Peering Break-Even Point helps make the business case for peering objective and clear—if an ISP can peer more traffic than indicated by the Peering Break-Even Point, then the ISP should prefer to peer instead of solely purchasing transit from an upstream ISP.
Let’s continue with our previous example and further assume that the market price for Internet Transit is $3.50 per Mbps.
From a strictly financial position, peering makes sense when the unit cost of peering is less than the cost of transit; that is, when more than $11,000/$3.50 = 3,143Mbps can be peered at this exchange point (Table 5-3).
Table 5-3. The break-even analysis with different transport costs into the IXP.
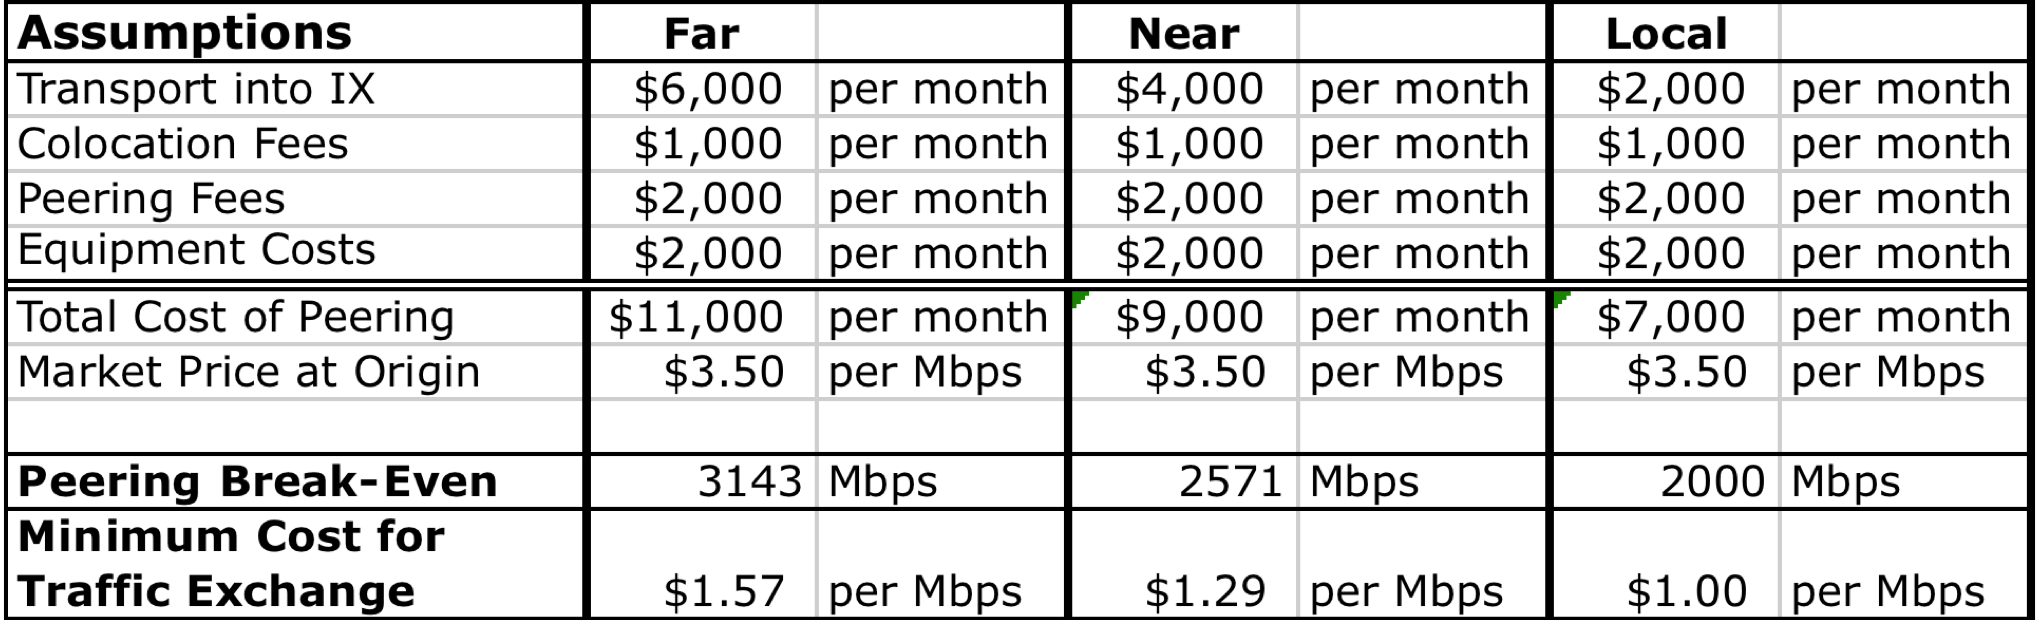
Remember the context—in this example, the prospective peer is building into the IXP from across a continent. The Peering Break-Even Point is lower for those who are “near” or “local” to the IXP, as shown in the other columns in the spreadsheet.
We are also assuming that the ISP is not already present in the colocation space. If the ISP already has a Point of Presence (POP) there, the business case for peering is much easier to make.
How much traffic can I send over the peering infrastructure?
Definition: The Effective Peering Bandwidth is the maximum amount of traffic that can be safely transported (without packet loss) across peering infrastructure.
The general rule is that the Effective Peering Bandwidth is about 70% of the smallest-sized physical layer capacity in the path to the peer. This rule accounts for framing overhead, some need to burst, and the sinusoidal nature of Internet traffic. So for these sample calculations, we assume that we can maximally use about 7Gbps of the 10Gbps capacity. This assumption seems to resonate with the peering coordinator community.
Effective Peering Bandwidth = 70% * 10Gbps = 7000Mbps
So when modeling using the service, one should not expect to be able to use more than 70% of the peering capacity.
What is the lowest cost for peering?
Definition: The Minimum Cost for Traffic Exchange is the lowest unit cost obtainable in a peering infrastructure deployment.
To calculate the lowest cost for traffic exchange, we simply divide the monthly cost of peering by the Effective Peering Bandwidth.
MinimumCostofTrafficExchange=MonthlyCostofPeering/Effective PeeringBW
In the best-case scenario we can use all of the effective peering bandwidth for our peering traffic exchanges with peers. Some would call this “running the peering interconnect hot”.
At this maximum utilization point, peering can cost about $1.57/Mbps:
MinimumCostofTrafficExchange=$11,000/7,000Mbp = $1.57/Mbps
This metric helps us identify if peering is even interesting. Will peering save enough money to be worth the effort?
With the analysis we have done, we proved that peering makes sense financially if you can peer more traffic than the Peering Break-Even Point, and that we can peer up to the Effective Peering Bandwidth.
Definition: The Effective Peering Range is the range of peering traffic exchange that makes sense financially.
The Effective Peering Range is the “Sweet Spot”, or to use an aircraft analogy, the landing strip that a peering coordinator must land on to save the company money by peering. It is measured as a range (in Mbps) between the Peering Break-Even Point and the Effective Peering Bandwidth.
After the business case has been approved and executed, this story suggests that the peering analysis should be on-going basis and adjusted based on market criteria.
Notes from the field.
Periodically Review Peering Analysis
At an early Gigabit Peering Forum, Bryan Garrett (BellSouth at the time) shared a good process tip. After the business case is made and accepted, it is a good idea to bring forward quarterly updates applying the same logic, terminology, and metrics. Peering can be a provably valuable alternative to simply purchasing transit, and it is important to track whether it remains a good strategy given the market price for transit.
Here are a few discussion questions from the Internet Peering Workshop.
Answers to these questions along with related FAQs and supplemental materials are here:
http://DrPeering.net/books/The-Internet-Peering-Playbook/peering-business-case.php
DrPeering.net ©2014 | Privacy Policy | Terms and Conditions | About Us | Contact Us
The 2014 Internet Peering Playbook is now available on the iPad at the Apple Store and for the Amazon Kindle. The Kindle, ePub and PDF form are also perpetually updated on the DrPeering DropBox share.